–
The Problem With GM Evaluation
–
Explanation/Background
While most people would understandably be interested in the gambling results of the project, the organizational scores (ORG Score, Coach Score, GM Score) are the foundation, as it contains the actual model. The initial inspiration for this project was to come up with a method to accurately evaluate organizations as a whole via the Coaching Staff and the Front Office performances in the same way that people like to evaluate the football players using analytics. Ideally, the organizational scores from this project would be efficient representations of what happens on- and off-the-field, but how would one know? How do you know how good a Head Coach is? And how much better is that one than another one? It admittedly all feels very subjective. But one would think that the people working for these organizations and made the decisions would (overall, over time) know best. So, I have turned to what happens to the Head Coaches after the season to see how the metrics generated from this project match with what actually happened. In this case, Organizational Actions that can happen are Coach of the Year, Left Team (not fired or retired – often phrased as “stepping away”), Retired, None (will return as HC for the same organization next season), Fired, and Fired Midseason. While the Coach Score represents the performance of the entire Coaching Staff, these actions only track actions relating to the Head Coach. However, changes to Offensive and Defensive Coordinators can be found in the Notes of the Actual version of the Organizational Scores section of the website. On this page, Head Coach is interchangeable with Coaching Staff unless a specific Head Coach is referenced.
–
Coach Score Average
Theoretically, the higher the Coach Score, the less likely that the Head Coach is going to get fired and vice versa. That may not always be the case, but overall, the distribution of scores should match the actions taken by the organization. Below is a chart of the average Coach Scores across the 6 organizational actions listed above.
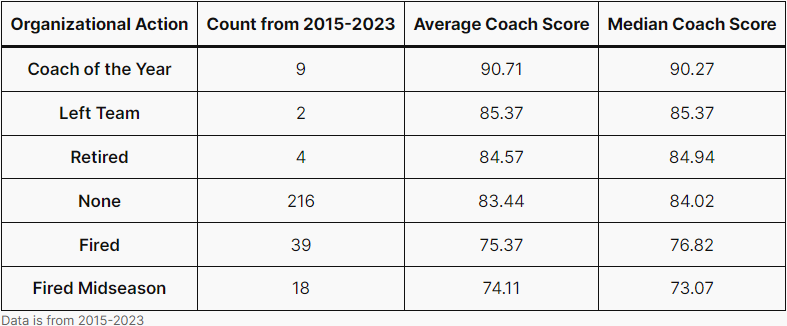


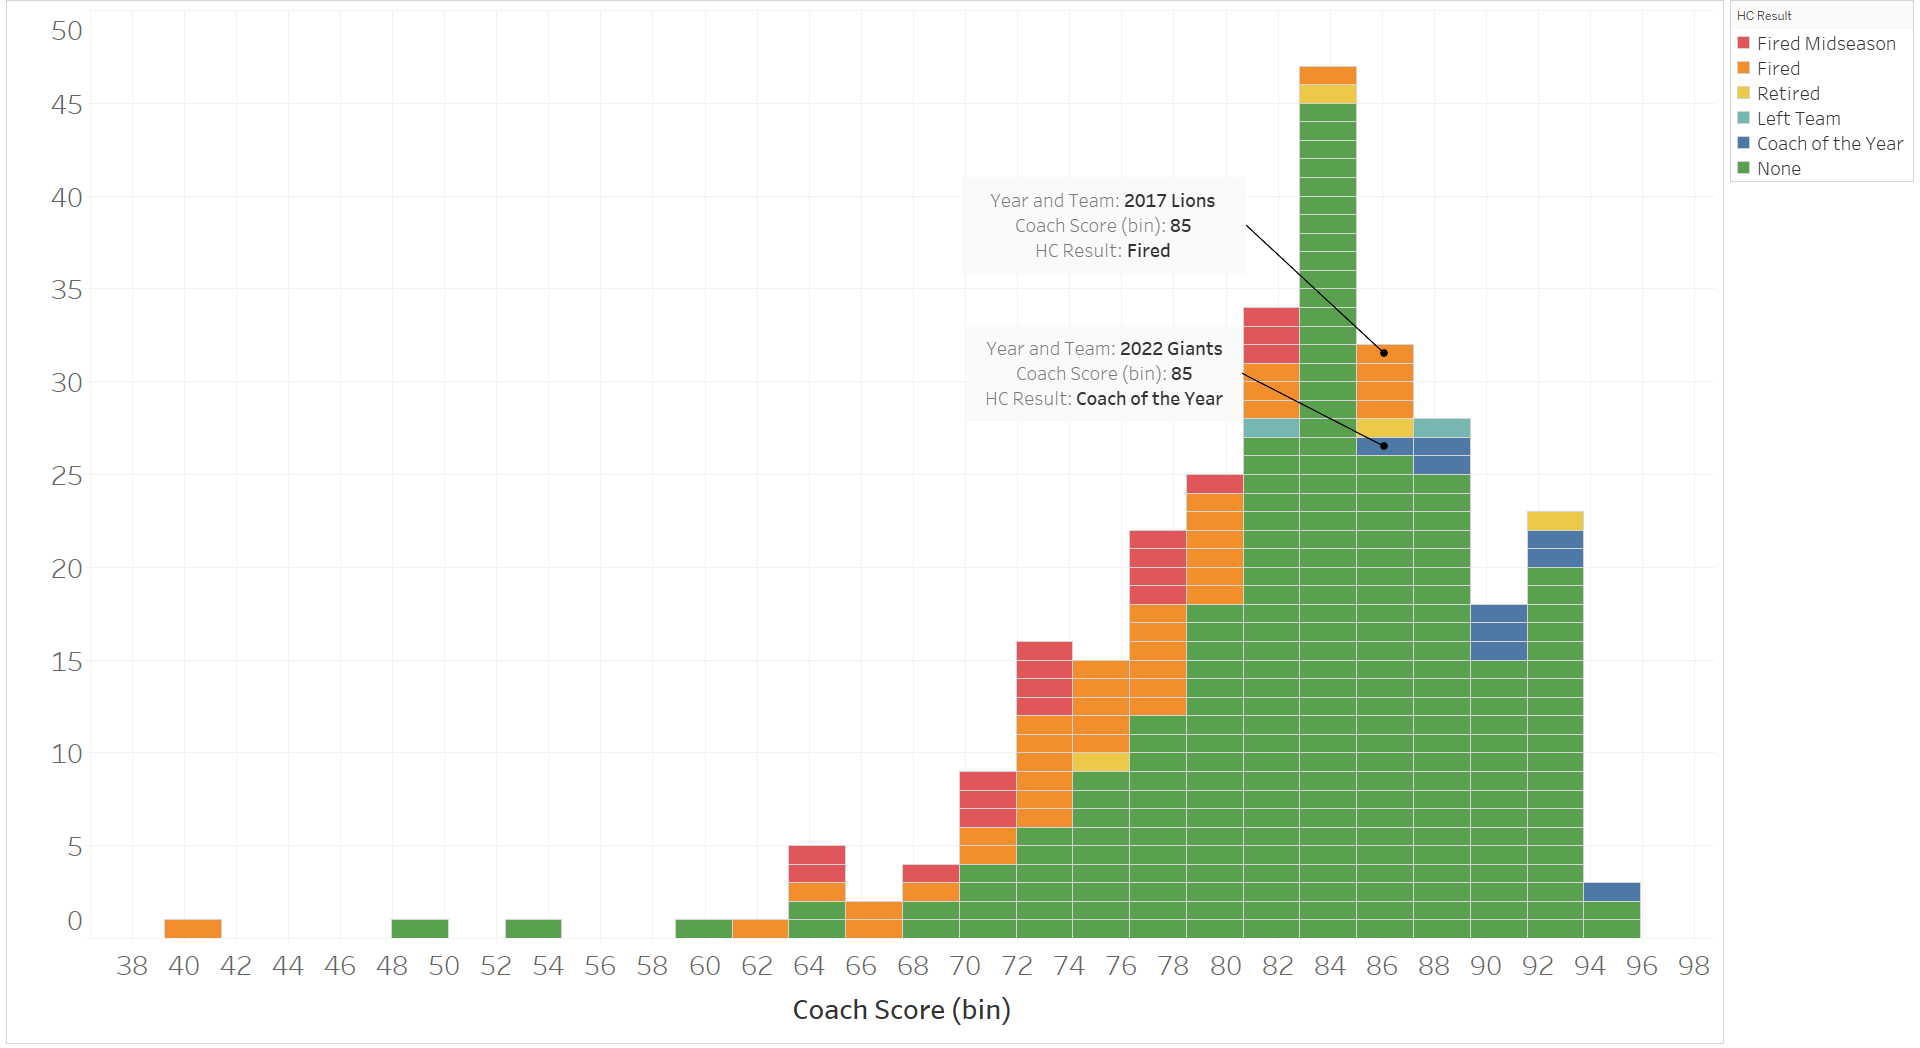
As one can see, as the actions become less ideal for the Head Coach (with Left Team and Retired being debatable in terms of which is better), the Coach Score decreases significantly. However, that is not to say that there is not any “noise.” In other words, the value from the model does not always match the action. In the histogram below, one can see the distribution of the Coach Score broken up by the organizational actions in separate colors. An example of the noise is the fact that the Head Coach of a Coaching Staff with an 85 Coach Score was voted Coach of the Year, while four Head Coaches with 85 Coach Scores were fired after their respective seasons. To be clear, that does not mean that I think that the model made a “mistake.” It’s actually the opposite. Do I think that the 2017 Detroit Lions Head Coach, Jim Caldwell, deserve to be fired? No, and the Lions paid for that mistake with the Matt Patricia era. And while I, in no way, think that 2022 New York Giants Head Coach Brian Daboll was a bad Head Coach that season, I do not think that he should have been Coach of the Year. The Giants had been bad for so long, the roster was not good, and it was his first season, so the sudden success led people to, in my opinion, overrate Daboll’s performance. I would argue that he was not even the best rookie (first-year) Head Coach that season. Vikings Head Coach, Kevin O’Connell, led the Vikings to a 13-4 record on 8.4 Expected Wins, while Daboll led the Giants to a 9-7-1 record on 8.3 Expected Wins. O’Connell set the NFL record for one-possession wins (wins by 8 or fewer points) in a season, going 11-0 in those games. However, O’Connell’s 95 Coach Score (highest in the league that season and 2nd highest between 2015-2023) was not enough to win the award. The highest Coach Score from 2015-2023 was Kansas City Chiefs Head Coach Andy Reid with a 95.5 in 2020. Reid did not win Coach of the Year for that season either.
–
Actual vs Predicted
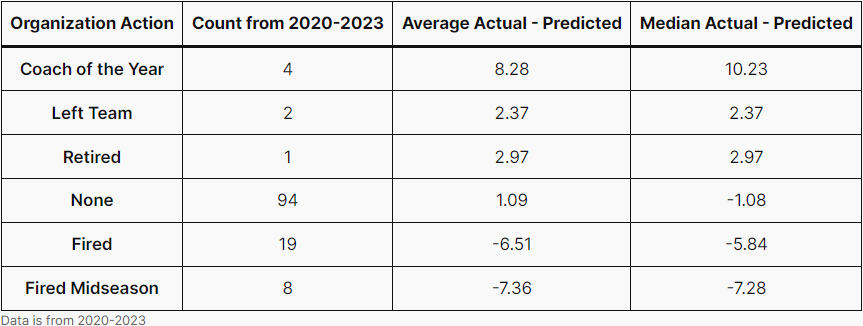
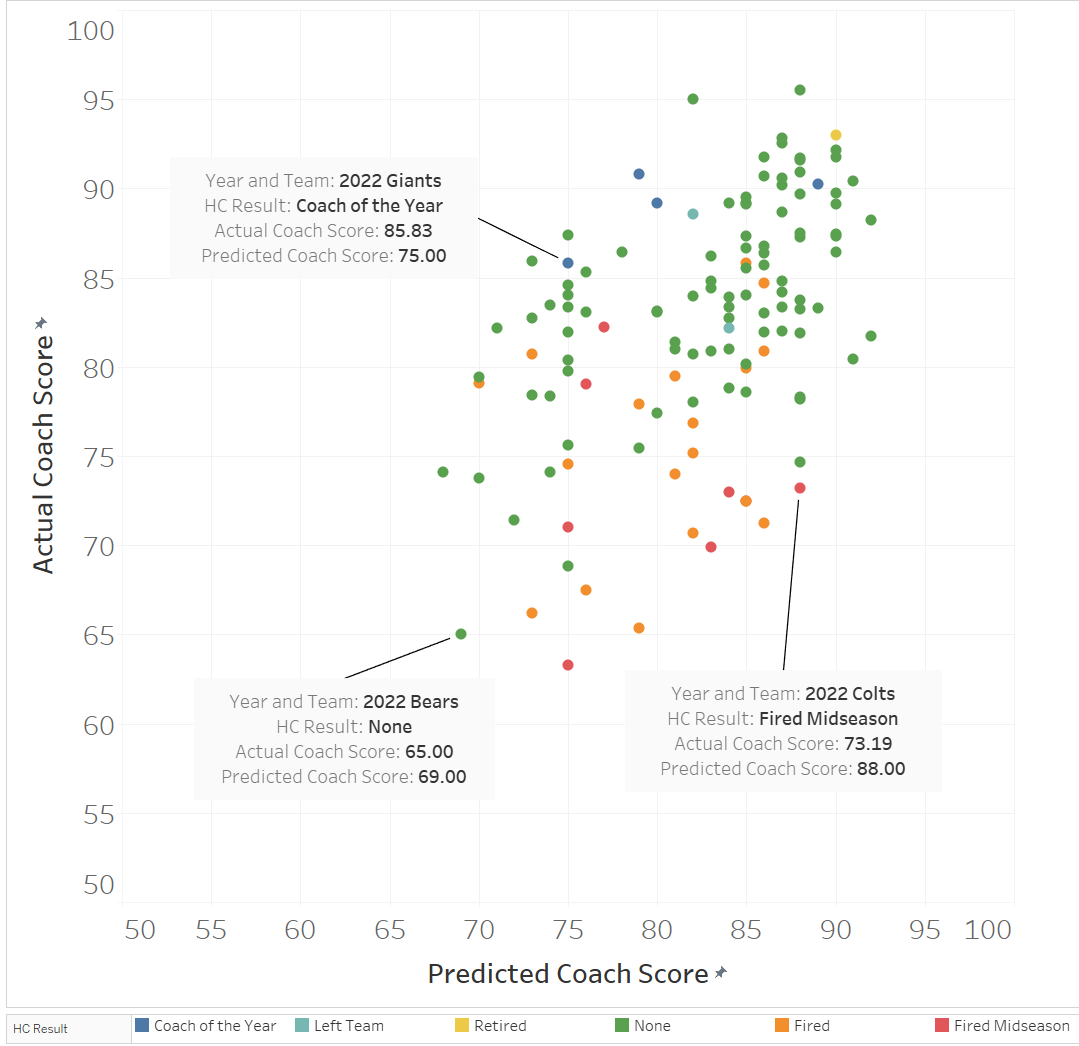
In Brian Daboll’s defense, performance above expectation should matter. Theoretically, the higher the difference between Actual Coach Score and Predicted Coach Score, the lower the chance of getting fired. And in terms of the organizational actions above, the difference between Actual and Predicted should be larger for the more favorable actions and lower, or even negative, for the less-favorable actions. The chart below shows that theory is generally true through the first four seasons of the model generating Score predictions (2020-2023).
The graph below shows the relationship between the Predicted Coach Scores and Actual Coach Scores on an individual Head Coach level with the Organizational Action signified by color. The Head Coaches in the bottom right corner should be the most likely to be fired as the expectation was of high performance, but their performance turned out to be subpar. The Head Coaches in the upper left corner should be the most safe, as their performance was much higher than expected, like Brian Daboll in 2022. The Head Coaches in the bottom left corner, like the 2022 Bears Head Coach, Matt Eberflus, had low expectations in their first season, so the poor performance was not worthy of being fired.
–
Heat Check
In Matt Eberflus’s defense, the Bears organization was not in a great state when he took over, and the situation that a Head Coach has been placed in should have some influence on an organizational action. Therefore, I have developed my own metric called “Heat Check” to measure the risk of a Head Coach getting fired incorporating some of the external forces (typically) out of the Head Coach’s control. For example, an organization’s decision of how much of the available total cap space that they are willing to spend in a season should affect the evaluation of the Head Coach’s and the overall team’s performances. Heat Check ranges from 0-100 and can be thought of as a percent chance that the Head Coach gets fired, where Head Coaches with a 0 are likely safe, and those with a 100 should probably be a little worried.
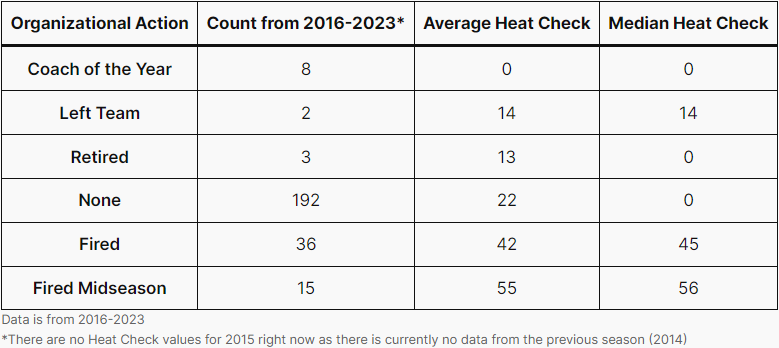
However, just like the Coach Score, Heat Check can get messy sometimes. For example, the 2023 Seahawks Head Coach, Pete Carroll, was fired with a Heat Check of 0. But I still agree with that Heat Check, as the decision seemed to be more of a political one within the organization than one that had to do strictly with performance. On the other hand, 2022 Bears Head Coach Eberflus had a 75.9 Heat Check and was allowed to keep his job. Whether it was a good decision is still not certain, as he improved his Coach Score from 65 to 78 in 2023 but would probably be seen as the weakest part of the Chicago Bears organization going into 2024. In order to simplify the Heat Check metric, I created a classification system: Safe, In Danger, and Hot Seat. Below is a chart that breaks down the distribution for these three general categories.

One could look at the chart above and say that this aspect of the model has an accuracy of 92%, as only 8% of the Head Coaches with a Safe designation were fired. However, another could say that it has an accuracy of 64%, as 36% of Head Coaches with a Hot Seat designation kept their positions. Once again, it’s hard to gauge “accuracy,” as organizations often take actions that turn out to be non-optimal. For example, in 2019, both the Chargers Head Coach, Anthony Lynn, and Lions Head Coach, Matt Patricia, each had a Heat Check of 100 and a Hot Seat classification, but neither were fired. Was the model wrong? Both Head Coaches were fired after the following season despite improving their performances. The model predicts what should happen and not what will happen. Speaking of expectation, introducing gambling creates a new method to assess the model.
Below is a chart of the Heat Checks for the 2023 season.
| Team | Heat Check – HC | Coach Score | Classification – HC | Organizational Action – HC | Wins Last Season | Wins This Season |
|---|---|---|---|---|---|---|
| 2023 Colts | 0 | 85.9 | Safe | None | 4 | 9 |
| 2023 Rams | 0 | 85.3 | Safe | None | 5 | 10 |
| 2023 Browns | 0 | 89.2 | Safe | Coach of the Year | 7 | 11 |
| 2023 Eagles | 0 | 89.7 | Safe | None | 14 | 11 |
| 2023 Texans | 0 | 87.4 | Safe | None | 3 | 10 |
| 2023 Lions | 0 | 89.2 | Safe | None | 9 | 12 |
| 2023 Packers | 0 | 83.1 | Safe | None | 8 | 9 |
| 2023 Steelers | 0 | 88.7 | Safe | None | 9 | 10 |
| 2023 Dolphins | 0 | 87.3 | Safe | None | 9 | 11 |
| 2023 49ers | 0 | 86.4 | Safe | None | 13 | 12 |
| 2023 Jets | 0 | 81.0 | Safe | None | 7 | 7 |
| 2023 Raiders | 0 | 82.2 | Safe | Fired Midseason | 6 | 8 |
| 2023 Giants | 0 | 80.7 | Safe | None | 9 | 6 |
| 2023 Ravens | 0 | 89.7 | Safe | None | 10 | 13 |
| 2023 Buccaneers | 0 | 82.2 | Safe | None | 8 | 9 |
| 2023 Seahawks | 0 | 85.8 | Safe | Fired | 9 | 9 |
| 2023 Broncos | 0 | 83.1 | Safe | None | 5 | 8 |
| 2023 Jaguars | 0 | 84.0 | Safe | None | 9 | 9 |
| 2023 Chiefs | 27.7 | 87.3 | Safe | None | 14 | 11 |
| 2023 Titans | 28.8 | 76.8 | Safe | Fired | 7 | 6 |
| 2023 Saints | 32.7 | 81.4 | In Danger | None | 7 | 9 |
| 2023 Bengals | 34.2 | 84.2 | Safe | None | 12 | 9 |
| 2023 Cardinals | 36.2 | 71.4 | Safe | None | 4 | 4 |
| 2023 Bills | 37.1 | 86.4 | Safe | None | 13 | 11 |
| 2023 Cowboys | 37.6 | 87.3 | Safe | None | 12 | 12 |
| 2023 FB Team | 37.8 | 75.2 | In Danger | Fired | 8 | 4 |
| 2023 Vikings | 44.9 | 78.8 | Safe | None | 13 | 7 |
| 2023 Bears | 50.1 | 78.4 | Hot Seat | None | 3 | 7 |
| 2023 Falcons | 55.7 | 79.5 | Hot Seat | Fired | 7 | 7 |
| 2023 Chargers | 60.7 | 72.5 | Hot Seat | Fired Midseason | 10 | 5 |
| 2023 Patriots | 70.6 | 70.7 | Hot Seat | Fired | 8 | 4 |
| 2023 Panthers | 100.0 | 63.3 | Hot Seat | Fired Midseason | 7 | 2 |
–
Gambling Performances
The way to measure the effectiveness of the model that most people would probably be interested in is the Return on Investment generated by using the Win Total predictions to make specific bets. Win Total Futures are a type of bet where sportsbooks set a line for how many wins each organization will accumulate in the upcoming season. The bettor will then choose whether the team will win more or fewer wins than that line. Theoretically, the more predictable and “stable” the league is, the higher the Return on Investment. A high-level overview of the gambling results can be found on the website homepage, more detailed results can be found on the Season homepages, and a full breakdown of the results can be found here.
| Line-ego | Team | ego | O/U | Line | Wins | 01 | 02 | 03 | 04 | 05 | 06 | 07 | 08 | 09 | 10 | 11 | 12 | 13 | 14 | 15 | 16 | 17 | 18 | Pace | Pace-ego | Odds | Result | RROI | Sportsbook |
|---|---|---|---|---|---|---|---|---|---|---|---|---|---|---|---|---|---|---|---|---|---|---|---|---|---|---|---|---|---|
| 3.45 | Jaguars | 3.05 | Under | 6.5 | 3 | 0 | 0 | 0 | 0 | 0 | 1 | – | 0 | 1 | 0 | 0 | 0 | 0 | 0 | 0 | 0 | 0 | 1 | 3 | 0.05 | 104 | 20.4 | 90.45% | Barstool |
| 2.98 | Bills | 13.48 | Over | 10.5 | 11 | 0 | 1 | 1 | 1 | 1 | 0 | – | 1 | 0 | 1 | 0 | 1 | 0 | 0 | 1 | 1 | 1 | 1 | 11 | 2.48 | -130 | 17.69 | 76.90% | William Hill |
| 2.70 | Broncos | 5.80 | Under | 8.5 | 7 | 1 | 1 | 1 | 0 | 0 | 0 | 0 | 1 | 1 | 0 | – | 1 | 0 | 1 | 0 | 0 | 0 | 0 | 7 | 1.20 | 105 | 20.5 | 95.30% | BetUS |
| 2.28 | Packers | 12.78 | Over | 10.5 | 13 | 0 | 1 | 1 | 1 | 1 | 1 | 1 | 1 | 0 | 1 | 0 | 1 | – | 1 | 1 | 1 | 1 | 0 | 13 | 0.22 | 102 | 20.2 | 96.98% | Barstool |
| 2.18 | 49ers | 8.32 | Under | 10.5 | 10 | 1 | 1 | 0 | 0 | 0 | – | 0 | 1 | 0 | 1 | 1 | 1 | 0 | 1 | 1 | 0 | 1 | 1 | 10 | 1.68 | 110 | 21 | 99.58% | Barstool |
| 2.17 | Seahawks | 11.67 | Over | 9.5 | 7 | 1 | 0 | 0 | 1 | 0 | 0 | 0 | 1 | – | 0 | 0 | 0 | 1 | 1 | 0 | 0 | 1 | 1 | 7 | 4.67 | -140 | 0 | 66.32% | BetUS |
| 2.16 | Falcons | 5.34 | Under | 7.5 | 7 | 0 | 0 | 1 | 0 | 1 | – | 1 | 0 | 1 | 0 | 0 | 1 | 0 | 1 | 0 | 1 | 0 | 0 | 7 | 1.16 | -105 | 19.52 | 70.44% | BetUS |
| 2.11 | Titans | 11.61 | Over | 9.5 | 12 | 0 | 1 | 1 | 0 | 1 | 1 | 1 | 1 | 1 | 1 | 0 | 0 | – | 1 | 0 | 1 | 1 | 1 | 12 | 0.39 | 110 | 21 | 75.39% | William Hill |
| 2.10 | Raiders | 9.10 | Over | 7 | 10 | 1 | 1 | 1 | 0 | 0 | 1 | 1 | – | 0 | 0 | 0 | 1 | 0 | 0 | 1 | 1 | 1 | 1 | 10 | 0.90 | -115 | 18.7 | 76.68% | Barstool |
| 1.98 | Eagles | 5.02 | Under | 7 | 9 | 1 | 0 | 0 | 0 | 1 | 0 | 0 | 1 | 0 | 1 | 1 | 0 | 1 | – | 1 | 1 | 1 | 0 | 9 | 3.98 | -125 | 0 | 59.01% | William Hill |
| 1.93 | Panthers | 5.57 | Under | 7.5 | 5 | 1 | 1 | 1 | 0 | 0 | 0 | 0 | 1 | 0 | 1 | 0 | 0 | – | 0 | 0 | 0 | 0 | 0 | 5 | 0.57 | -115 | 18.70 | 61.55% | BetUS |
| 1.89 | Chiefs | 13.89 | Over | 12 | 12 | 1 | 0 | 0 | 1 | 0 | 1 | 0 | 1 | 1 | 1 | 1 | – | 1 | 1 | 1 | 1 | 0 | 1 | 12 | 1.89 | -130 | 10 | 56.43% | William Hill |
| 1.85 | Saints | 7.65 | Under | 9.5 | 9 | 1 | 0 | 1 | 0 | 1 | – | 1 | 1 | 0 | 0 | 0 | 0 | 0 | 1 | 1 | 0 | 1 | 1 | 9 | 1.35 | -140 | 17.14 | 57.58% | William Hill |
| 1.72 | Buccaneers | 13.22 | Over | 11.5 | 13 | 1 | 1 | 0 | 1 | 1 | 1 | 1 | 0 | – | 0 | 1 | 1 | 1 | 1 | 0 | 1 | 1 | 1 | 13 | 0.22 | 100 | 20 | 60.61% | William Hill |
| 1.71 | FB Team | 6.79 | Under | 8.5 | 7 | 0 | 1 | 0 | 1 | 0 | 0 | 0 | 0 | – | 1 | 1 | 1 | 1 | 0 | 0 | 0 | 0 | 1 | 7 | 0.21 | -120 | 18.33 | 62.12% | BetUS |
| 1.67 | Jets | 4.83 | Under | 6.5 | 4 | 0 | 0 | 0 | 1 | 0 | – | 0 | 1 | 0 | 0 | 0 | 1 | 0 | 0 | 0 | 1 | 0 | 0 | 4 | 0.83 | -148 | 16.76 | 62.46% | Barstool |
| 1.55 | Steelers | 10.05 | Over | 8.5 | 9 | 1 | 0 | 0 | 0 | 1 | 1 | – | 1 | 1 | 0 | 0 | 0 | 1 | 0 | 1 | 0 | 1 | 1 | 9 | 1.05 | 110 | 21 | 65.26% | Barstool |
| 1.50 | Cowboys | 8.00 | Under | 9.5 | 12 | 0 | 1 | 1 | 1 | 1 | 1 | – | 1 | 0 | 1 | 0 | 0 | 1 | 1 | 1 | 1 | 0 | 1 | 12 | 4.00 | -120 | 0 | 56.08% | BetUS |
| 1.47 | Bengals | 5.03 | Under | 6.5 | 10 | 1 | 0 | 1 | 1 | 0 | 1 | 1 | 0 | 0 | – | 1 | 1 | 0 | 0 | 1 | 1 | 1 | 0 | 10 | 4.97 | -115 | 0 | 47.86% | William Hill |
| 1.39 | Colts | 11.39 | Over | 10 | 9 | 0 | 0 | 0 | 1 | 0 | 1 | 1 | 0 | 1 | 1 | 1 | 0 | 1 | – | 1 | 1 | 0 | 0 | 9 | 2.39 | -110 | 0 | 40.47% | William Hill |
| 1.29 | Chargers | 7.71 | Under | 9 | 9 | 1 | 0 | 1 | 1 | 1 | 0 | – | 0 | 1 | 0 | 1 | 0 | 1 | 1 | 0 | 0 | 1 | 0 | 9 | 1.29 | 105 | 10 | 38.54% | Barstool |
| 1.20 | Browns | 11.20 | Over | 10 | 8 | 0 | 1 | 1 | 1 | 0 | 0 | 1 | 0 | 1 | 0 | 1 | 0 | – | 1 | 0 | 0 | 0 | 1 | 8 | 3.20 | -115 | 0 | 32.25% | William Hill |
| 1.10 | Vikings | 7.90 | Under | 9 | 8 | 0 | 0 | 1 | 0 | 1 | 1 | – | 0 | 0 | 1 | 1 | 0 | 0 | 1 | 1 | 0 | 0 | 1 | 8 | 0.10 | -114 | 18.77 | 34.66% | Barstool |
| 1.01 | Ravens | 10.49 | Under | 11.5 | 8 | 0 | 1 | 1 | 1 | 1 | 1 | 0 | – | 1 | 0 | 1 | 1 | 0 | 0 | 0 | 0 | 0 | 0 | 8 | 2.49 | -160 | 16.25 | 35.82% | BetUS |
| 0.77 | Lions | 5.77 | Over | 5 | 3 | 0 | 0 | 0 | 0 | 0 | 0 | 0 | 0 | – | 0 | 0 | 0 | 1 | 0 | 1 | 0 | 0 | 1 | 3 | 2.77 | 105 | 0 | 30.38% | Barstool |
| 0.73 | Dolphins | 9.73 | Over | 9 | 9 | 1 | 0 | 0 | 0 | 0 | 0 | 0 | 0 | 1 | 1 | 1 | 1 | 1 | – | 1 | 1 | 0 | 1 | 9 | 0.73 | -135 | 10 | 29.22% | William Hill |
| 0.48 | Rams | 10.02 | Under | 10.5 | 12 | 1 | 1 | 1 | 0 | 1 | 1 | 1 | 1 | 0 | 0 | – | 0 | 1 | 1 | 1 | 1 | 1 | 0 | 12 | 1.98 | 110 | 0 | 24.43% | Barstool |
| 0.38 | Texans | 4.88 | Over | 4.5 | 4 | 1 | 0 | 0 | 0 | 0 | 0 | 0 | 0 | 0 | – | 1 | 0 | 0 | 0 | 1 | 1 | 0 | 0 | 4 | 0.88 | 135 | 0 | 19.99% | Barstool |
| 0.29 | Cardinals | 8.21 | Under | 8.5 | 11 | 1 | 1 | 1 | 1 | 1 | 1 | 1 | 0 | 1 | 0 | 1 | – | 1 | 0 | 0 | 0 | 1 | 0 | 11 | 2.79 | -115 | 0 | 15.85% | BetUS |
| 0.24 | Bears | 7.26 | Under | 7.5 | 6 | 0 | 1 | 0 | 1 | 1 | 0 | 0 | 0 | 0 | – | 0 | 1 | 0 | 0 | 0 | 1 | 1 | 0 | 6 | 1.26 | -120 | 18.33 | 18.10% | BetUS |
| 0.16 | Patriots | 9.16 | Over | 9 | 10 | 0 | 1 | 0 | 0 | 1 | 0 | 1 | 1 | 1 | 1 | 1 | 1 | 1 | – | 0 | 0 | 1 | 0 | 10 | 0.84 | -125 | 18 | 20.09% | William Hill |
| 0.07 | Giants | 7.07 | Over | 7 | 4 | 0 | 0 | 0 | 1 | 0 | 0 | 1 | 0 | 1 | – | 0 | 1 | 0 | 0 | 0 | 0 | 0 | 0 | 4 | 3.07 | 115 | 0 | 16.34% | BetUS |
Above is an example of this evaluation; it is the 2021 Win Total Futures summary. That season the model had a win percentage of 62.07% (18-13-1) with a Return on Investment for all 32 bets of 16.34% (+5.23 units). If the model were 100% correct, then it would win every bet, but that would be nearly impossible. If the sportsbooks were exactly splitting bets into 50/50 chances, then the chances of winning all 32 bets would be 1 / (2^(32)) or (1 / 4294967296), which can be simplified to a 0.0000000232% chance. However, thankfully, the model does not need to be that accurate in order to be successful. If every bet were -110, then the model would need to predict 52.38% of bets correctly to break even. But often the odds of Win Total Futures are not -110, so that break even point may not be accurate depending on the specific portfolio of bets. Below is a chart of the odds and win percentage data through the first four seasons of the model.
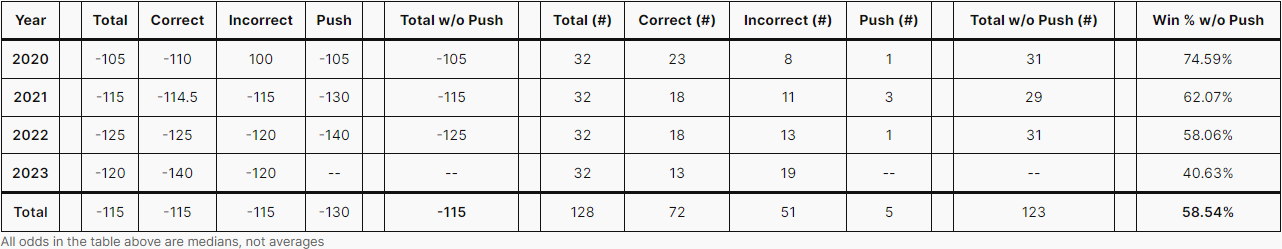
After taking out the Pushes (bets where the result matched the line, and the money bet is returned in full), the median odds for the 123 total bets is -115. The break even win percentage for -115 is 53.49%, so any win percentage over that mark is going to generate a positive Return on Investment (assuming that all bets have the same amount bet, as is with this project). Through the first four seasons of the model making predictions, it has won 58.54% of its Win Total Futures bets, translating to an average Return on Investment of over 10% per season.
–
The Problem with GM Evaluation
If you have made it to this point, then you’ve probably noticed that most of the accuracy measurements above deal with the Coach Score, and I haven’t really mentioned the GM Score (even though it’s incorporated in the Gambling Performance via the Win Totals predictions). The issue is that the GM Score’s connection to the Organizational Actions related to General Managers are not as clean as the Coach Scores. It’s relatively common knowledge that General Managers have more job security than Head Coaches, and that makes sense, considering that what they do takes multiple seasons to accomplish. GMs are expected to complete complicated long-term tasks, such as rebuilding a roster, while Head Coaches are just expected to win games. I would also say that people focus more on Head Coaches, because the results of their performances are extremely public, as tens of millions watch the games every week. So whether or not an organization fires a General Manager may not be as straightforward as for a Head Coach. The GM Score is typically going to follow the same general waveform structure as the ORG Score, so when an organization should move on from a GM is not so obvious. Regardless, I have created a Heat Check metric for GMs.
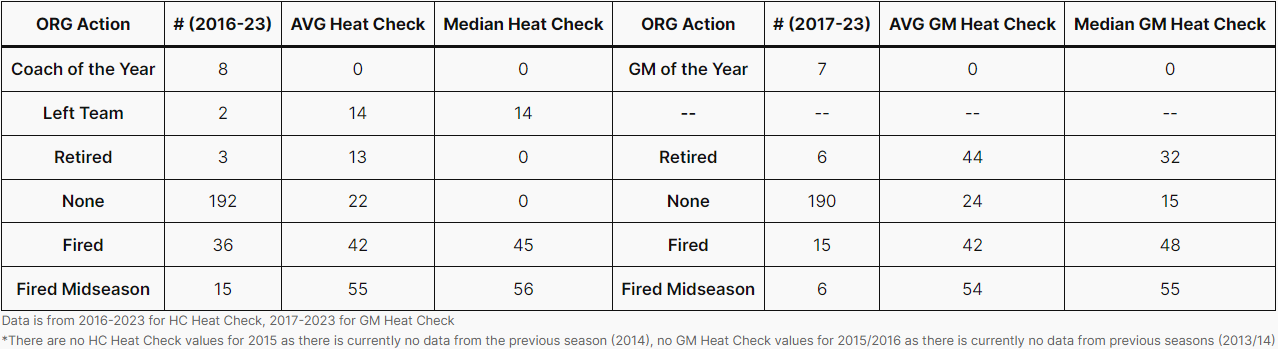
GM Score Average
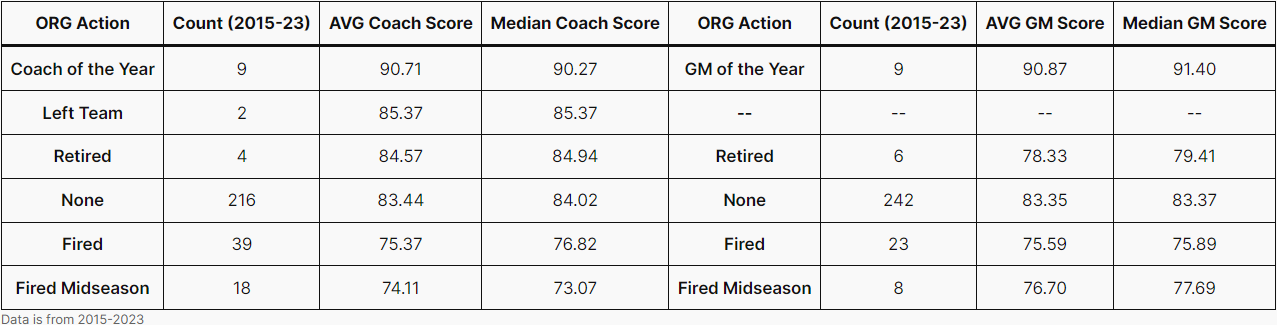
As one can see in the table above, the decrease down the table is not quite as clear when compared to the Coach Score. As stated above, part of this difference is due to organizations being in varying states of the waveform cycle, so a poor season from a GM might not result in a firing.
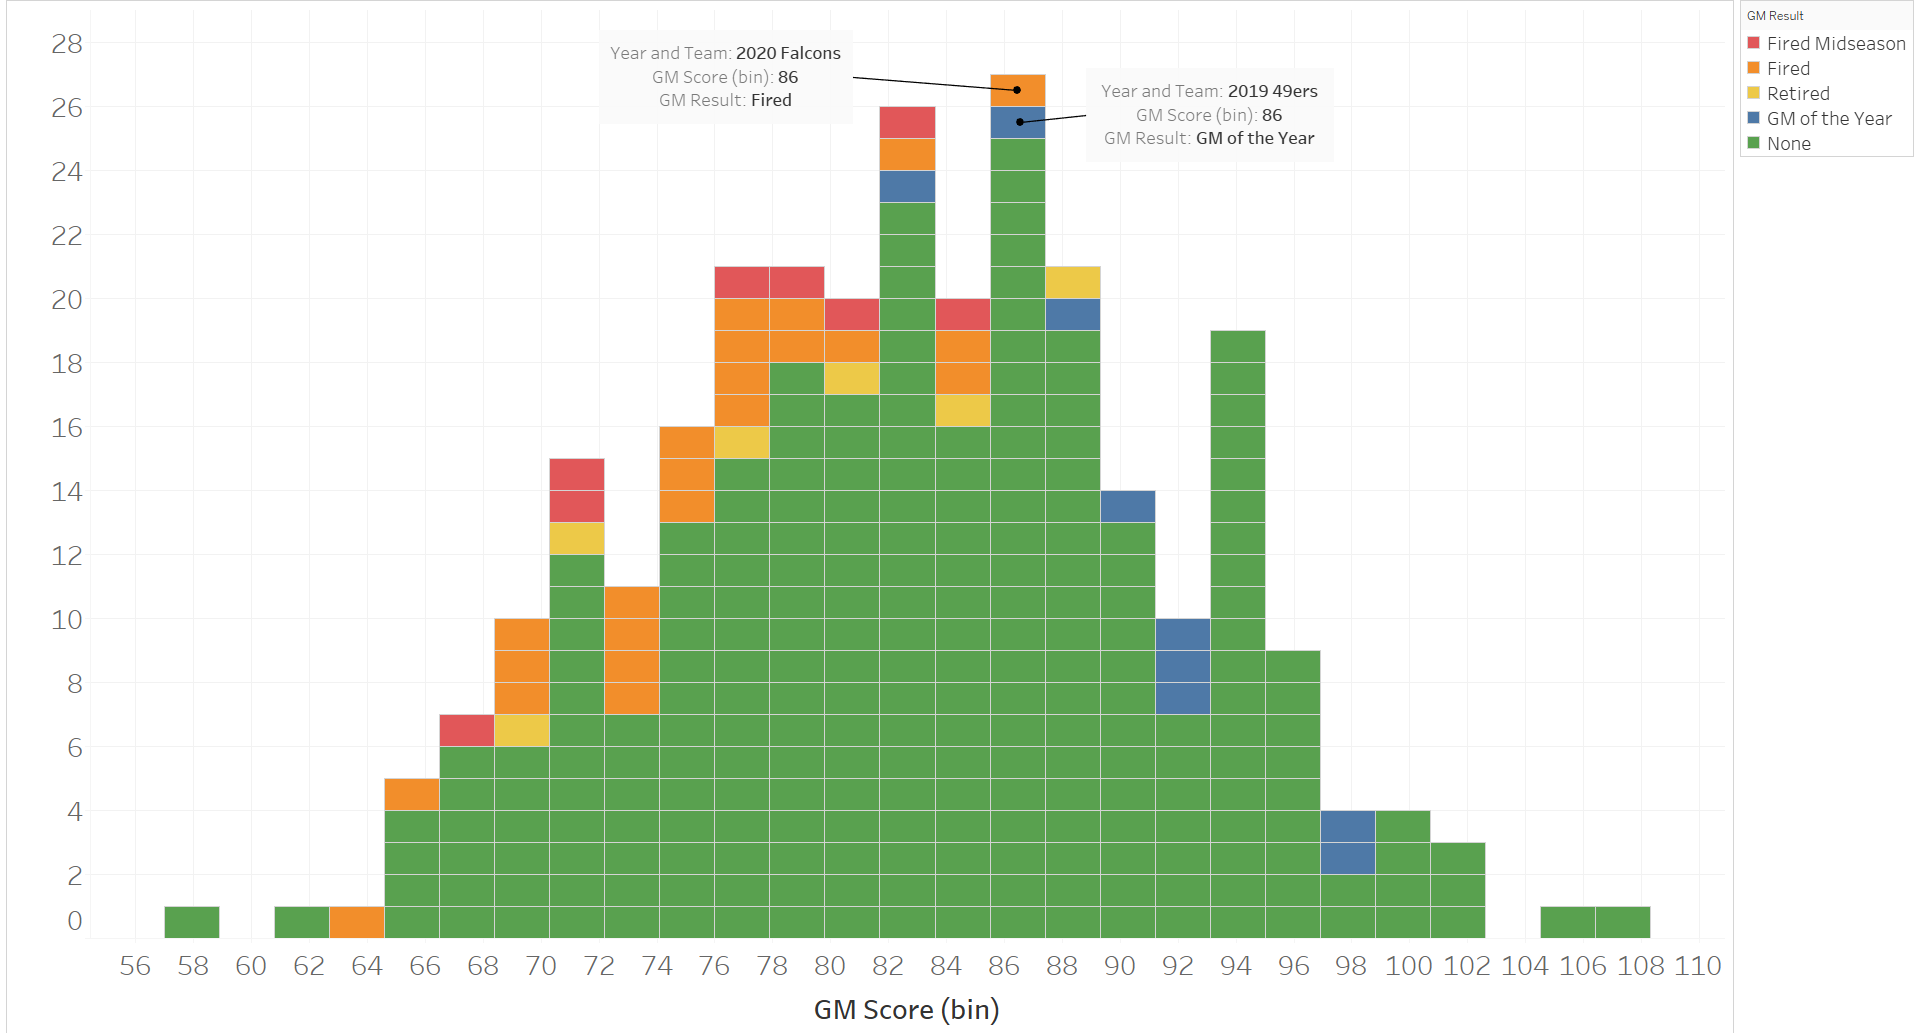
Another difference one can notice is that while they both are centered around 82-84, the distribution of the GM Score is much more normally distributed than the Coach Score. However, they are similar in their “messiness,” as shown with multiple bins having a General Manager named GM of the Year and a GM fired. The bin designated above, 86-87, shows a great example of the complexities of evaluating a General Manager. For the 2020 Atlanta Falcons, their championship window had come to a close. They had just finished their 3rd season past their most recent playoff appearance and won the fewest games since 2013 (4), the low point of their last rebuild. As an organization, they were on the way down, but it was not the GM’s fault. The GM’s 87 far outperformed the Coach Score of 68. In fact, despite not making the playoffs, the Falcons Front Office was doing everything they could keep the championship window open. Regardless, ownership wanted a fresh start, firing both the Head Coach and the General Manager. The Head Coach had a Heat Check of 100, and the General Manager had a Heat Check of 0. Since these firings (2021-2023), the Falcons have won 7 games each season, missing the playoffs each time. After the 2023 season, they fired the new Head Coach, while the new General Manager just used the 8th overall pick of the 2024 Draft on a QB, despite signing veteran QB Kirk Cousins to a massive deal in free agency before the draft in a widely ridiculed move. Was firing the General Manager in 2020 a good decision? I wouldn’t have thought so back then, and I have yet to see anything to change my mind since. Despite losing the Super Bowl in the most heartbreaking fashion, the Front Office had shown that they could build a Super Bowl-caliber team in 2017. Not only that, but the General Manager had been there since 2008, guiding them through two separate championship windows in a 10-year span. He and his staff knew how to build and rebuild a roster, making the Falcons decision after the 2020 season a shocking one. The 2019 San Francisco 49ers were in the inverse situation. The GM had been hired in 2017 after the 49ers hit rock bottom with a 2-14 record. After two seasons of rebuilding, the 49ers improved significantly, going from 4 wins (GM Score of 71) in 2018 to 13 wins (GM Score of 86) in 2019. A big reason of the jump in wins was the coaching, but the underlying reason for this jump in performance is that the GM was able to put a roster together that suited the Head Coach’s preference and style of operation (and the Quarterback stayed healthy). The 49ers went to the Super Bowl before losing to the Kansas City Chiefs. 2019 was a huge opening to a championship window, which, had it not been for a Quarterback injury in the following season, would have generated 5 straight extremely talented, playoff-caliber teams. In those 5 seasons, the 49ers went to 4 Conference Championship games and 2 Super Bowls, losing both. As of 2024, this window is not just still open, but in fact, appears to be in great shape. Quarterback Brock Purdy may not be the long-term solution, but he has enabled the 49ers to keep the window alive due to his rookie contract, allowing more spending flexibility for the rest of the roster and granting the Front Office some recovery after the quagmire of a trade to draft Quarterback Trey Lance.
Actual vs Predicted
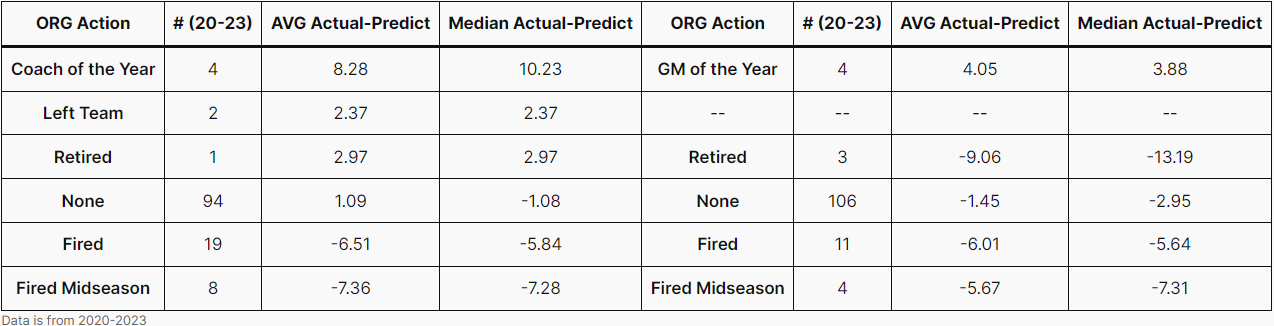
When evaluating GMs, the [Actual-Predicted] difference should be much more accurate than just the Actual GM Score. The Predicted GM Score takes into account the waveform nature of the league, so the difference between Predicted and Actual should indicate which General Managers over- and underachieved in any season. The table below shows that, while once again not as smooth as the Coach side, the organizational actions follow a similar decreasing pattern down the table.
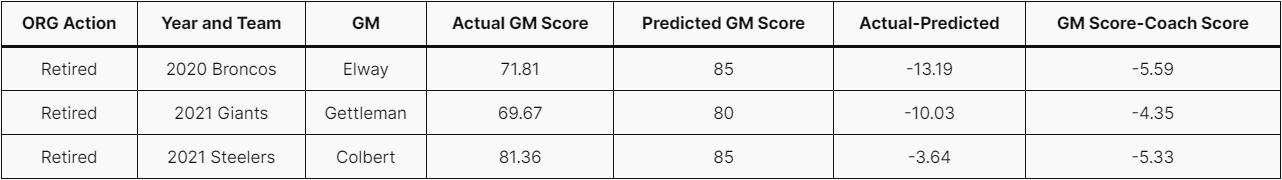
One can see from the table below why the Retired organization action for GMs looks so off. Broncos GM John Elway and Giants GM Dave Gettleman were given an easy way out despite deserving to be fired, while Steelers GM Colbert probably would not have been fired and likely was going to retire regardless of the outcome of the season.
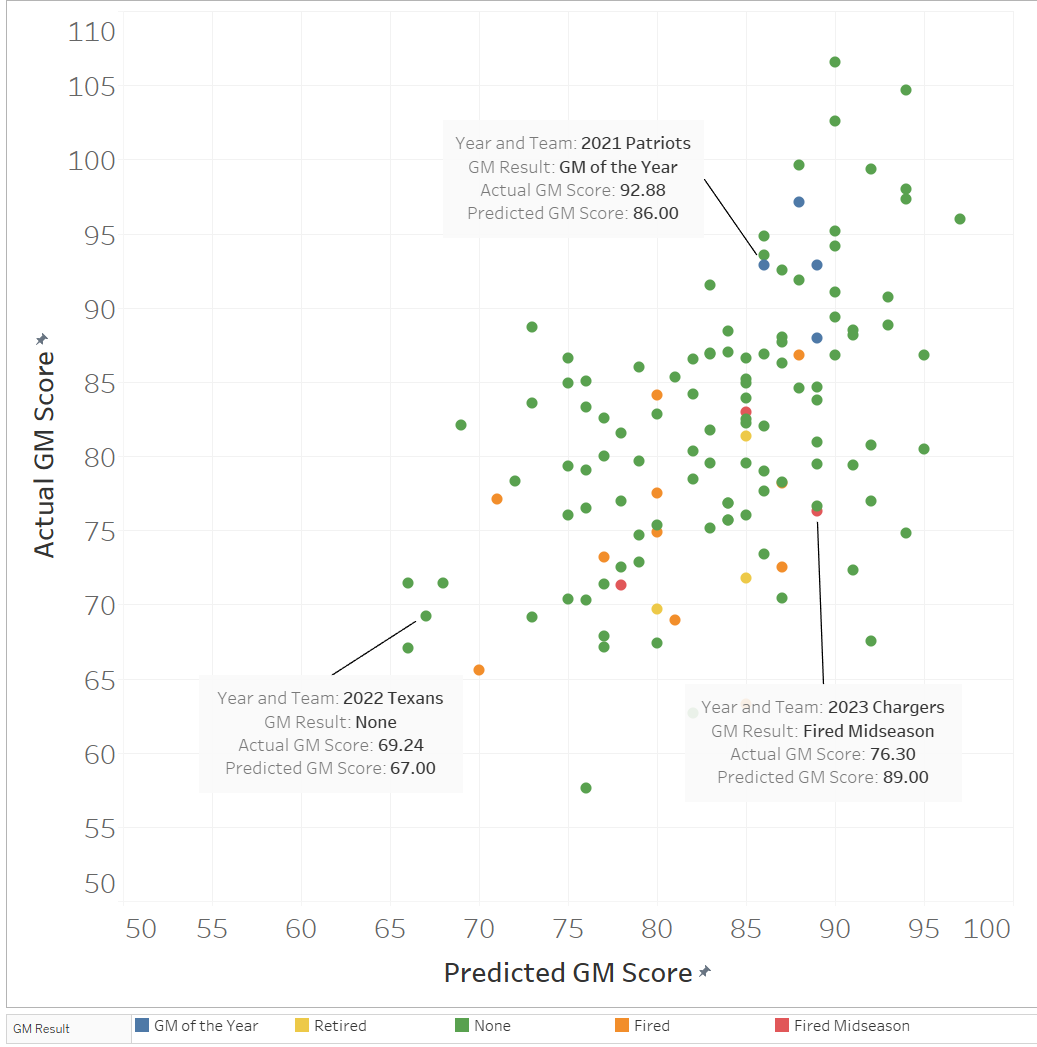
Below is a scatterplot similar to the one used for the Coach Score above. It looks at the relationship between the Predicted GM Score and Actual GM Score. While maybe not as clear as the Coach Score version, one can see that the majority of the firings happen in the bottom right half of the graph, where the Predicted GM Score is greater than the Actual GM Score.
GM Heat Check
The GM Heat Check works in a similar fashion to the Coach version. The idea is that there are factors outside of simply the GM Score, so adding context helps more accurately evaluate the Front Office’s performance. For example, the GM Heat Check takes the waveform nature of the league that was mentioned above into account. Ideally, the GM Heat Check would follow the same trend as the Coach Heat Check when it comes to organizational actions, in that as the GM Heat Check should increase as the actions become more negative. The table below reflects that trend. As with the GM [Actual-Predicted] table, the Retired organizational action disrupts what would have been a relatively smooth increase in GM Heat Check.
| Team | Heat Check – GM | GM Score | Classification – GM | Organizational Action – GM | Wins Last Season | Wins This Season |
|---|---|---|---|---|---|---|
| 2023 Cowboys | 0 | 99.6 | Safe | None | 12 | 12 |
| 2023 Dolphins | 0 | 86.9 | Safe | None | 9 | 11 |
| 2023 Ravens | 0 | 91.9 | Safe | None | 10 | 13 |
| 2023 49ers | 0 | 88.2 | Safe | None | 13 | 12 |
| 2023 Buccaneers | 0 | 84.9 | Safe | None | 8 | 9 |
| 2023 Rams | 0 | 83.6 | Safe | None | 5 | 10 |
| 2023 Saints | 0 | 86.9 | Safe | None | 7 | 9 |
| 2023 Steelers | 0 | 85.2 | Safe | None | 9 | 10 |
| 2023 Lions | 0 | 88.0 | Safe | GM of the Year | 9 | 12 |
| 2023 Bengals | 0 | 90.7 | Safe | None | 12 | 9 |
| 2023 Packers | 0 | 79.1 | Safe | None | 8 | 9 |
| 2023 Jaguars | 0 | 82.2 | Safe | None | 9 | 9 |
| 2023 Broncos | 0 | 84.2 | Safe | None | 5 | 8 |
| 2023 Titans | 0 | 77.0 | Safe | None | 7 | 6 |
| 2023 Bills | 0 | 91.1 | Safe | None | 13 | 11 |
| 2023 Jets | 3.9 | 75.7 | In Danger | None | 7 | 7 |
| 2023 Colts | 13.3 | 70.4 | In Danger | None | 4 | 9 |
| 2023 Vikings | 15.0 | 79.3 | In Danger | None | 13 | 7 |
| 2023 Cardinals | 16.0 | 71.4 | In Danger | None | 4 | 4 |
| 2023 Browns | 17.1 | 76.8 | In Danger | None | 7 | 11 |
| 2023 Bears | 30.4 | 81.5 | In Danger | None | 3 | 7 |
| 2023 Chiefs | 32.1 | 88.5 | Safe | None | 14 | 11 |
| 2023 Texans | 40.5 | 76.0 | In Danger | None | 3 | 10 |
| 2023 Giants | 42.4 | 62.7 | In Danger | None | 9 | 6 |
| 2023 Falcons | 43.8 | 78.5 | In Danger | None | 7 | 7 |
| 2023 Patriots | 48.4 | 77.5 | In Danger | Fired | 8 | 4 |
| 2023 Chargers | 55.1 | 76.3 | Hot Seat | Fired Midseason | 10 | 5 |
| 2023 Raiders | 55.7 | 71.3 | Hot Seat | Fired Midseason | 6 | 8 |
| 2023 Seahawks | 57.5 | 76.0 | Hot Seat | None | 9 | 9 |
| 2023 Eagles | 64.7 | 74.8 | Hot Seat | None | 14 | 11 |
| 2023 Panthers | 67.2 | 69.0 | Hot Seat | Fired | 7 | 2 |
| 2023 FB Team | 100.0 | 63.3 | Hot Seat | Fired | 8 | 4 |
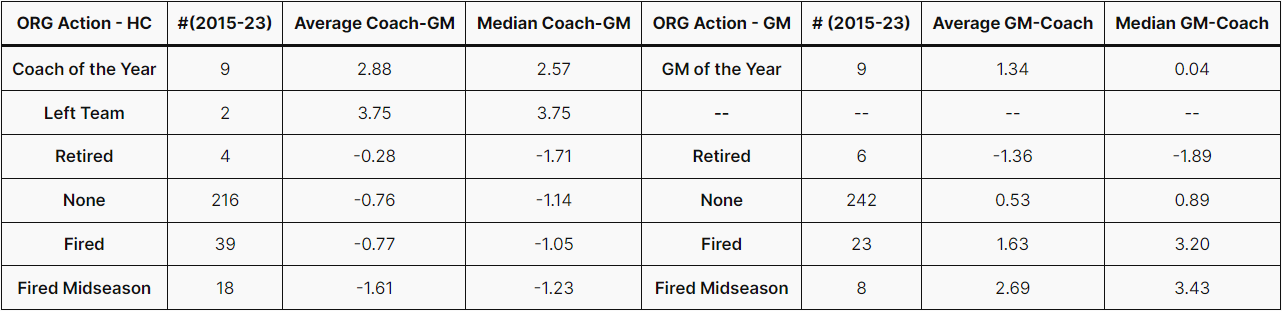
Part of GM Heat Check is the difference between the GM Score and the Coach Score, or in other words, how well the Front Office performed versus the Coaching Staff. Unlike the [Actual-Predicted] and Heat Check tables above, the table below tells a different story. For Head Coaches, their performance versus the General Managers’ is a clear indicator of the Organizational Action, but for General Mangers, the inverse appears to be true. While the General Managers who win GM of the Year do not, on average, get outperformed by their respective HCs, the difference is smaller than the one for General Managers who get fired at some point, either during or after the season. This discrepancy between the trend for the Coach Heat Check and the GM Heat Check would support the idea that organizations make decisions regarding both Coaching Staffs and Front Offices primarily based on the on-the-field performance, despite much of General Managers’ work being off-the-field.